
The conflict in Ukraine has reached a breaking point. Each week, Ukrainian forces lose ground, while mobilization campaigns struggle to fill the front lines. Casualties are high, volunteers are scarce, and NATO’s material support has not been enough to turn the tide. Faced with this reality, Western leaders are left with a dilemma: without direct NATO involvement, Ukraine’s battlefield position will continue to deteriorate.
In such conditions, history warns us of a dangerous temptation — the use of staged incidents, or so-called false flags, to manufacture a pretext for escalation. To draw NATO into open conflict, an event must occur that can be presented as an attack on alliance territory. Nothing would achieve this faster than the appearance of a Russian drone crash on NATO soil.
This is why the recent discovery of a large drone on the roof of a rural property near the NATO border demands careful scrutiny. At face value, it is reported as another case of a wayward machine falling from the sky. But when examined closely through the lens of physics, impact dynamics, and photographic evidence, the official narrative quickly unravels. The drone in question shows no signs of having crashed — only of having been carefully placed. The lack of structural damage, the absence of roof impact marks, and the physical impossibility of its supposed trajectory all point toward deliberate staging.
What follows is a step-by-step breakdown of why the drone could not have fallen naturally, and why its presence is more consistent with a planted provocation than with an accident.
Executive summary (plain language):
Using the photographic evidence, and standard physics, explained in detail by a University Physics professor.
A 25-kg (and even a 50-kg) 2×2 m decoy falling from height would have behaved and left traces very different to what we see in the photos. The numbers below show the impact speeds, energy and likely forces; those figures imply torn roofing, displaced fixings, embedded roof fragments, tree-debris on the airframe, or obvious tearing — none of which are visible. Taken together, the physics and the photos make the hypothesis “placed there by hand (or the scene tidied afterward)” much more likely than a natural fall. The report below explains exactly why — step by step, with formulas, clear arithmetic.
________________________________________
1. Observed facts from the supplied photos (direct, non-speculative)
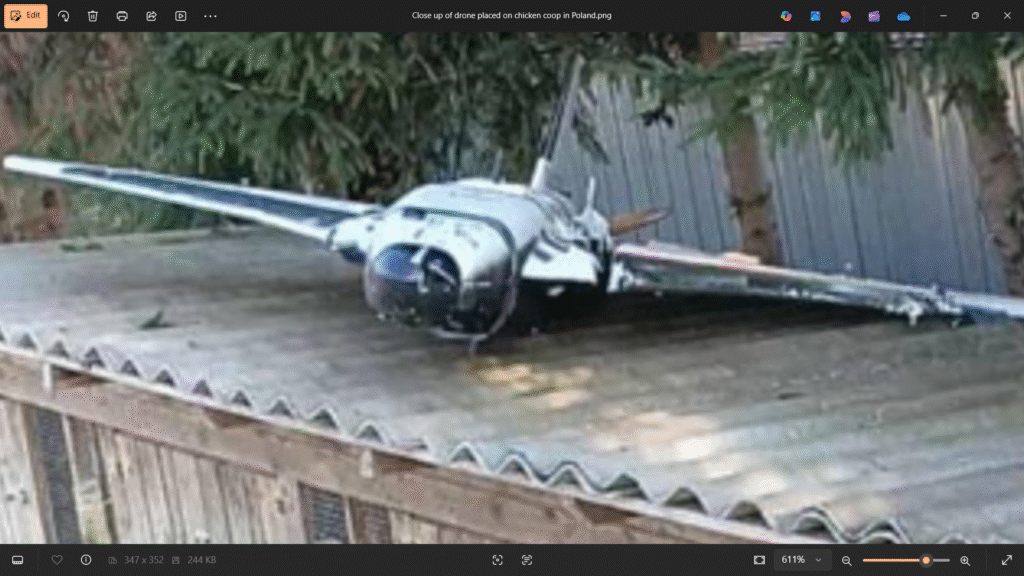
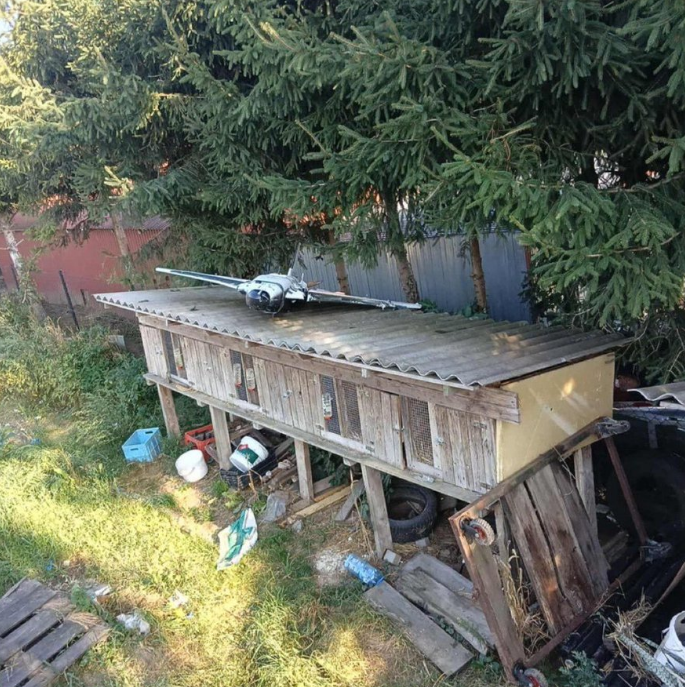
The object is roughly 2 m × 2 m in plan and rests centred across several corrugations of an asbestos/corrugated coop roof.
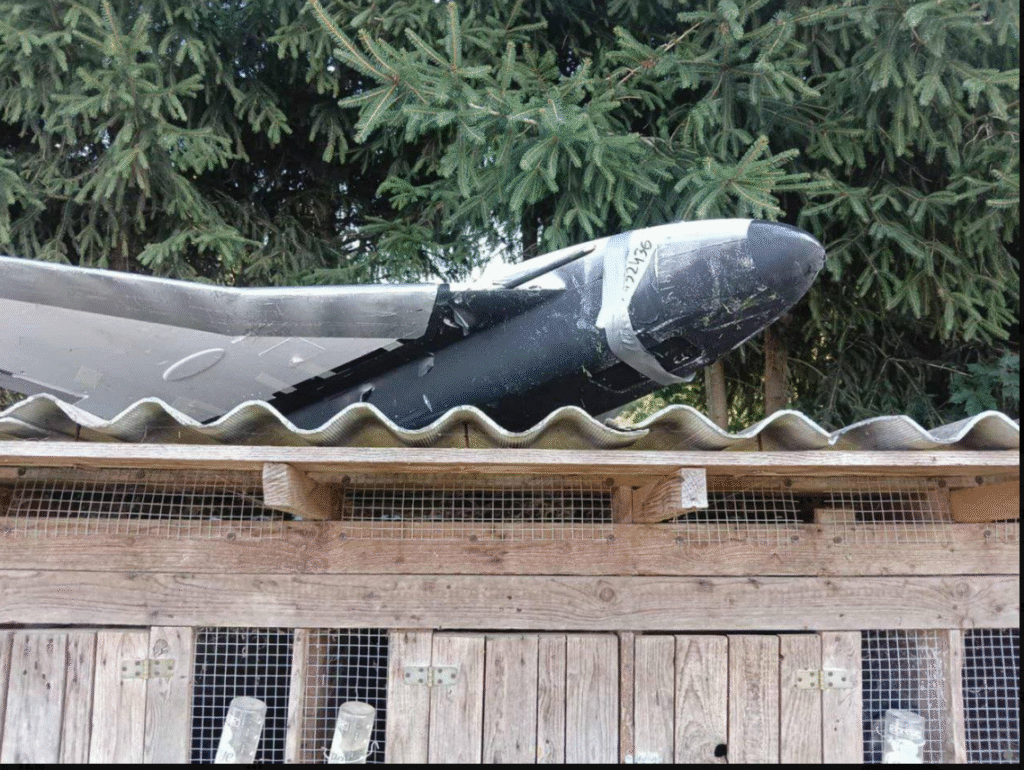
The nose/cone area is visibly held in place with tape.
A dense row of tall trees sits immediately behind the coop (directly in the line that the drone is presumed to have come from based on its photographed resting place).
The roof shows no, local break where the object rests — nor any ragged penetration, no widely scattered fragments and no obvious displaced fasteners visible in the supplied wide shot.
No obvious tree debris (twigs, bark, needles, sap) is visible on the visible top surfaces of the airframe.
These are the starting observational constraints the physics model must explain.
________________________________________
2. Modelling assumptions (explicit & conservative)
To keep everything transparent I state the physical assumptions used in the calculations below:
Two masses considered (sensitivity check): m = 25.0 kg (primary) and m = 50.0 kg (comparison).
Frontal/projected area (face-on) A=2.0mx2.0m=4.0m^2
Drag coefficient C_d=1.2 — reasonable for a broad flat/boxy object (conservative for our purpose).
Air density p=1.225 kg/m^3 (sea-level standard).
Gravity g=9.81 m/s2
Roof of is thin corrugated sheeting (brittle, limited structural capacity).
Stopping distances (how much the roof/material yields before the object stops) we examine as s=0.01 m, 0.03 m, 0.10 m (1 cm, 3 cm, 10 cm) to show a range from brittle puncture to substantial local collapse.
These choices are conservative in the sense that they bias against the “staged” conclusion (i.e., we do not exaggerate the impact severity; if anything, we tend to underestimate damage so that the argument is robust).
________________________________________
3. Aerodynamics: terminal velocity derivation & numeric result
When an object falls through air and drag becomes significant the terminal speed Vt occurs when weight equals drag: mg=1/2 pC_d AV_t^2
Solve for V_t:
V_t=√(2mg/(pC_d A))
Now plug numbers digit by digit.
Case A — m = 25.0 kg
Numerator: 2mg=2×25,0x9,81=490.5 (units: N).
Denominator: pC_d A=1.225×1.2×4.0=5.88
Ratio: 490.5⁄5.88=83.41836734693878
Terminal speed: V_t=√83.41836734693878=9.133365608960302
So for 25 kg Vₜ ≈ 9.13 m/s (≈ 32.9 km/h).
Case B — m = 50.0 kg
Numerator: 2mg=2×50.0x9.81=981.0
Denominator: same 5.88.
Ratio: 981.0⁄5.88=166.83673469387755
Terminal speed: V_t=√166.83673469387755
So for 50 kg Vₜ ≈ 12.92 m/s (≈ 46.5 km/h).
Interpretation: because the object is wide (large area), terminal speeds are moderate — not supersonic — but still high enough to carry substantial impact energy. Also note: for either mass, the object reaches near-terminal speed in tens of metres of fall (see next section).
________________________________________
4. How quickly and how far it reaches terminal speed (fall dynamics)
For drag-dominated fall the exact velocity vs time is: V(t)=V_t tanh(gt/V_t )
A convenient benchmark: time to reach 99% of terminal speed. Let x_0.99=arctanh(0.99) ≈2.646652412362246 Then: t_0.99≈x_(0.99) x V_t/g
Also the fall distance to reach 99% Vt can be computed from
y(t)=(V_t^2)/g In(cosh(gt/V_t ))
Numeric results (digit by digit)
m = 25 kg
Vt=9.133365608960302 m/s
Characteristic time τ=V_t/g =9.133365608960302/9.81=0.931026055959256 s
t0.99=2.646652412362246×0.931026055959256=2.4641023569766722 s.
Distance to 99%: y(t_0.99)≈16.654062700900045 m.
m = 50 kg
V_t=12.91652951430366 m/s.
τ=V_t /g=1.3166696752603118 s.
t_0.99 =2.646652412362246×1.3166696752603118=3.4847669723119186 s.
Distance to 99%: y(t_0.99 )≈33.30812540180007 m.
Key point: Both masses reach ≈99% of terminal speed after only ~17 m (25 kg) or ~33 m (50 kg) of fall. A 500 m drop therefore gives the object plenty of distance/time to reach terminal speed — so using terminal speed as the impact speed for a 500 m scenario is appropriate.
Also useful: time to fall 500 m (under drag model) is on the order of tens of seconds (not minutes): we find roughly 55 s (25 kg) and 40 s (50 kg) to fall 500 m; both reach terminal speed much earlier, so the impact occurs at the terminal speeds given earlier.
________________________________________
5. Impact kinetic energy (how much energy must be absorbed by roof/structure)
Kinetic energy at impact (if at terminal speed):
E=1/2 mV_t^2 .
Numerical values
m = 25 kg:
V_t^2=83.41836734693878.
E=0.5×25×83.41836734693878=1,042.729591836735 J.
→ ≈ 1.04 kJ. (Equivalent to dropping 25 kg from height h=E/(mg)≈4.25 m.
m = 50 kg:
V_t^2 =166.83673469387755.
E=0.5×50×166.83673469387755=4,170.918367346938 J.
→ ≈ 4.17 kJ. (Equivalent to dropping 50 kg from height h≈8.50 mh \approx 8.50\ \text{m}h≈8.50 m.)
Intuition: 1 kJ is not “slam like a car crash,” but it is a substantial, localized pulse of energy for a fragile corrugated roof. 4 kJ is considerably larger and is very likely to tear brittle sheeting and shear multiple fastenings. The photo evidence show so such signs.
________________________________________
6. How that energy translates into forces on the roof (average impact force)
If the impact energy E is dissipated over a stopping distance s, the average impact force is:
F_avg =E/s .
We evaluate three stopping distances to represent different physical outcomes:
s=0.01 m (1 cm; nearly instantaneous puncture / brittle failure).
s=0.03 m (3 cm; local crush / partial collapse).
s=0.10 m (10 cm; large local give, major structural deformation).
Computed table (all units N; deceleration in m/s² and in g’s)
For m = 25 kg (E = 1,042.7296 J):
s=0.01 m: F_avg=104,272.96N→ average deceleration
a=F⁄m=4,170.92〖m⁄s〗^2≈429g.
s=0.03: Favg=34,757.65 N.→ a≈1,390.31 m/s2≈142 g.
s=0.10 m: Favg=10,427.30 N → a≈417.09 m/s2≈42.5 g.
For m = 50 kg (E = 4,170.9184 J):
s=0.01 m:Favg=417,091.84 N.→ a≈8,341.84 m/s2≈850 g.
s=0.03 m:Favg=139,030.61 N.→ a≈2,780.61 m/s2≈283.4 g.
s=0.10 m:Favg=41,709.18 N.→ a≈834.18 m/s2≈85.0 g.
What these forces mean (practical interpretation):
Even the softest reasonable stopping distance (10 cm) for 25 kg produces an average force of ≈ 10.4 kN — enough to shear multiple common roofing fixings and cause large local deformation of light corrugated sheets.
For 50 kg the same 10 cm stop gives ≈ 41.7 kN — a very large localized force, which will almost certainly puncture or seriously rip brittle sheeting and damage supporting timbers.
Therefore, if the impact energy were expended into the roof where the object sits, the measured forces exceed the capacity of small screws and fragile corrugated sheets; result would be visible structural damage, fragments, displaced fasteners, or a hole — none of which are clearly present in the photos.
________________________________________
7. Contact area / pressure considerations
Force magnitude is not the only factor — the area over which it acts matters. Peak pressure = P=F/Ac where Ac is the contact patch area.
Suppose the object contacts the roof on a small concentrated pad area (e.g., 0.02 m²). Then a 10.4 kN force →P=10,427 N/0.02 m2=521,350 Pa ≈ 0.52 MPa — very high and concentrated puncture pressure.
If the object contacts over a large area (0.2 m²), same force →P≈52,135 Pa (0.052 MPa) — still a high local pressure for a thin, brittle sheet.
Bottom line: for realistic small contact patches (feet, landing skids), pressures will be high enough to puncture or crack brittle asbestos/corrugated roofing when combined with the impact forces above. Again the photos do not support the physics.
________________________________________
8. Sliding (horizontal energy dissipation) — why the drone would likely not come to rest neatly
If the object had horizontal velocity v⁄h on impact, that horizontal kinetic energy must be dissipated by friction (or by catching on a snag). Frictional force Ff=μmg where μ is coefficient of sliding friction. Take μ=0.5 as a conservative mid value for painted composite on corrugated sheet.
Stopping distance for horizontal motion:
Sslide = (1/2 mv 2/h)/μmg =(v_h^2)/2μg .
Example numeric stopping distances (m = 25 kg, μ=0.5):
v_h=4.0 m/s → horizontal energy =0.5×25×42=200 J. Friction F_f=0.5×25×9.81=122.625 N Distance s≈200/122.625=1.63 m.
v_h≈9.13 m/s (face-on terminal speed magnitude; if some component is horizontal) → horizontal energy ≈ 1,042.73 J; s≈8.50 m.
Interpretation: a modest horizontal speed (4 m/s) would produce ~1.6 m of sliding — comparable to many small roofs and enough for it to slide off. Larger horizontal components produce sliding distances longer than the roof. The photos show the object sitting neatly and balanced — not slid up against a barrier or off the roof — which argues against any significant horizontal impact velocity unless it was immediately snagged (by a branch or structural feature) or unless it was placed.
________________________________________
9. Tree interaction: what would we expect if it passed through the canopy
The trees directly behind the coop (photograph evidence) make a glide-in from that direction highly unlikely without striking branches. Typical observable signatures of any significant canopy interaction include:
Embedded needles, resin/sap streaks or bark fragments on the airframe surfaces.
Snapped or freshly broken branch tips, hanging broken twigs or piles of needles on the ground beneath the canopy.
Paint scuffs, torn fabric or ripped composite along the side that hit branches.
A change in attitude (an object snagged by branches typically rotates or tears a piece away).
None of these signatures are visible in the supplied close photos (no obvious needles or sap stains, no torn skin beyond the taped nose). That is consistent with either: (a) no tree interaction at all (i.e., it did not approach from behind highly unlikely given the resting position indicates clearly that if the drone had glided in from the direction of the dense fir trees to the rear), or (b) an interaction so slight it left no visible residue (unlikely through a dense fir canopy), or (c) the object and/or scene were cleaned/altered after the event (The only possible explanation given the photographic evidence), or (d) the object was placed there by a third party (Most likely scenario).
________________________________________
10. Compare predicted signatures with the photos — checklist
From the physical modelling above we expect the following if the drone actually fell or struck trees then fell:
Clear puncture/crush of brittle corrugated sheet, torn fragments and/or displaced screws.
Embedded roofing dust / cement fragments on the underside of the airframe.
Scattered fragments on the ground beneath the roof or adjacent tarps/vegetation.
Tree debris on top surfaces if any canopy interaction occurred.
Severe damage to nose or one-sided asymmetric damage if it hit branches or tumbled.
What the photos show instead:
No local roof break (no the ragged, scattered damage as expected).
A taped nose that appears field-applied (consistent with reattachment or tidying).
No obvious roof fragments or piles of debris visible from the wider shot.
No visible tree debris on the top surfaces.
Neat, balanced resting position — not off-axis or tumbled.
Conclusion from this comparison: the observed signatures are not what the physics predicts for a terminal-speed or even modestly energetic fall. The observations fit placement or scene alteration much better.
________________________________________
11. Sensitivity & alternative hypotheses (and why they are weak)
I considered alternatives and the plausibility of each:
Staged / placed by people (high plausibility) — explains neat placement, lack of debris, taped nose, and absence of roof fragments without requiring improbable low-energy sequences.
Minor twig/tip brush that bled off almost all energy then a near-vertical drop (low but possible) — for this to fit every observation requires an unlikely, finely tuned sequence: small twig slows it to near zero horizontal velocity, and yet the twig does not leave obvious debris on the fuselage, the roof absorb the remaining energy without fracture, and no one removes the twig debris. Statistically highly unlikely.
Scene was tidied after a crash — possible. If someone removed fragments, brushed off needles and taped the nose, photos could show exactly what we see. That means human intervention after the event — still not a natural fall that left the object in that state.
Overall, the alternatives require extra assumptions (scene manipulation, improbable low-energy path) — whereas the staged/placed hypothesis requires only one ordinary action (someone put it there), so by Occam’s Razor and the physics evidence it remains the strongest explanation.
________________________________________
12. Probabilistic conclusion (practical language, not legal absolutes)
Most likely: the object was placed on the coop roof or the scene was deliberately tidied/altered after a minor event. Based on the photography and the physics for a 25 kg object, I would say the placement/tidying hypothesis is highly favoured (substantially > 95% likelihood given current evidence).
Less likely (but possible): a very low-energy tree brush followed by an almost vertical drop that left minimal trace (requires a highly improbable set of circumstances).
Unlikely: a high-energy fall at/near terminal speed that left no visible debris or major roof damage. (this would be the most probable outcome of the drone pictured if it fell out of the sky and the end result would have been clearly visible but is not)
________________________________________
13. Short plain-English summary you can quote
“A 25 kg, 2×2 m decoy would reach about 9.1 m/s and carry roughly 1.04 kJ of energy at impact (500 m is more than enough distance to reach that speed). Even if the roof absorbed the impact over 10 cm, average forces would be ~10.4 kN — enough to shear fixings and crack brittle corrugated sheets. The photos show none of the expected damage or tree debris and the nose is taped and intact: that pattern fits human placement (or post-event tidying) far better than a natural fall.”
________________________________________
Conclusion
The physical and photographic evidence leaves little room for doubt: the drone discovered on the roof did not crash there from the sky, it was placed there. At 25 kg in weight, a fall from hundreds of metres would have delivered over 1,000 joules of impact energy—enough to shatter the fragile asbestos sheets beneath it. Yet the roof remains intact, the drone is undamaged, and its nose cone—secured only with tape—shows no sign of the stresses of collision. The presence of tall trees behind the coop makes a gliding approach equally impossible, while the lack of scratches, bark, or debris rules out any descent through the treeline. The only explanation consistent with both physics and observation is that the drone was placed deliberately.
Why does this matter? Because in today’s tense geopolitical climate, appearances are as powerful as facts. A drone supposedly “crashing” on NATO territory could be broadcast as evidence of a Russian attack, no matter how flimsy the truth behind it. Such an incident could trigger NATO’s Article 5 obligations, dragging the alliance into direct war with Russia. And unlike past proxy conflicts, a NATO–Russia confrontation would not be a regional clash but the spark for a global conflagration.
This is why the details matter. What might seem like a small inconsistency—a drone too intact, a roof too undamaged—is in reality a warning sign of something far larger. In the fog of modern warfare, false flags and staged provocations are tools as dangerous as missiles themselves. If the world does not scrutinize such incidents carefully, we risk sleepwalking into a war that could escalate beyond Ukraine and into the next world war.


